Bathymetry
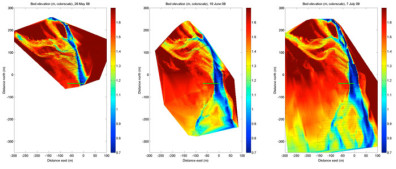
We periodically measured bathymetry near Craft Island during 2009 by pushing around a golf cart with GPS mounted (pictured top right). Figures above show bathymetry (colorscale) interpolated from GPS waypoints taken every 2 seconds (black dots). The location x=0 corresponds to 122deg, 28min, 26.16sec west, and y=0 corresponds to 48deg, 21min, 14.16sec north. A cross-section at y=-40m (section plotted below, location of section marked by green lines above) shows substantial channel evolution May-June, but little evolution June-July. Data can be downloaded by DRI researchers (if you’ve forgotten password, email Steve Henderson) in ASCII files with columns for lat, lon, and m elevation (May 26-27, June 19-21, July 7-8) and also in matlab files (May 26-27, June 19-21, July 7-8).
Known problems with data: We’ll probably find and post problems as we go. Please email Steve Henderson (contact info on home page) if you find anything wrong. There’s a potential constant offset between these elevations and NAVD88, and this offset is not the same as for 2008 data. I will fix this when I get the zero sorted out. The vertical accuracy of the instrument was better than 5cm. We didn’t allow for cart tilt, which could be significant on steep-sided channels.
Wind, Atmospheric pressure
Wind and atmospheric pressure were measured by a Hobo weather station on the flats near Craft Is (pictured right). This matlab file contains the data, plus some info in the variable called units. Note that wind directions are given as direction wind comes from, clockwise from true north.
Currents, Water pressure
Currents and water pressures were measured with Nortek Aquadopps. All measured near Craft Is. First, check-out the readme. Other files: List of pipes instruments were on, as pdf, and as excel spreadsheet, picture of pipe locations, matlab file with location data. Data from Pipe 1, Pipe 2, Pipe 4, Pipe 5, Pipe 7, Pipe 8, Pipe 12, Pipe 14.
Currents, Water pressure, CTD profiles
CTD profiles were measured using RBRs. Data will be posted as it is processed.
Questions/comments? Email to: juliamullarney@vancouver.wsu.edu, C.C. steve_henderson@wsu.edu