The most updated lab writing instructional modules are available: engineeringlabwriting.org
Learning Objectives
This module is designed to assist engineering instructors in strengthening lab instruction materials so that students should be able to:
- Define and explain trendlines (aka curve fitting, least squares fit, lines of best fit, and regression).
- Identify a plausible trend by observation of plotted bivariate data.
- Define the coefficient of determination and use it to quantify the correlation of data assuming a particular trend.
What is a Trendline?
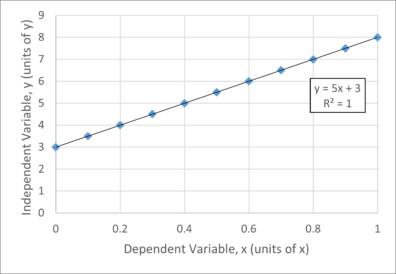
A trendline is a line fitted to experimental data that minimizes the square of the error between the values on the line and the values of the data. It is described as a line of best fit. Any trend can be used (e.g. linear, quadratic, logarithmic). See Figure 1 for an example of a linear trendline.

Figure 1: An example of a linear trendline.
Why Does the Technical Audience Value Trendlines?
Trendlines demonstrate a trend in data quickly and visually. If the equation and coefficient of determination (R2) are shown, the results are valuable both qualitatively and quantitatively. The trendline can be used for interpolation of values (estimating values within the tested range) as well as extrapolation of values (estimating values outside the tested range).
What is a Coefficient of Determination (R2 value)?
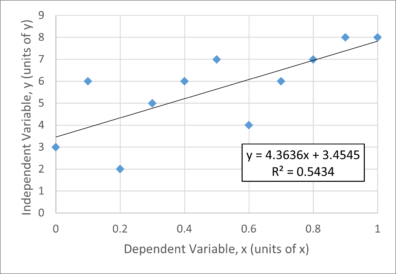
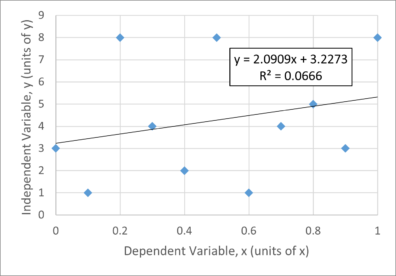
The coefficient of determination quantifies the ability of the trendline to predict the data. An R2 value of 1.0 indicates that the trendline can be used to predict values exactly, while a value of 0.0 indicates that the trend does not describe the data at all, or conversely that the data do not fit the selected trend. See Figures 2, 3, and 4 for examples of various R2 values.
What Expectations Does the Technical Audience Have for Plotted Bivariate Data?
- Ensure that the independent variable is on the y-axis and the dependent variable is on the x-axis.
- Display the trendline, which will provide a function, y(x).
- Display the coefficient of determination.
How Can we Select Appropriate Trends?
Knowing the shape of various functions is critical to selecting an appropriate one for your data. Fortunately, most software packages used for plotting allow you to change your selection easily and compare the coefficient of determination for each. Microsoft Excel provides common trends as options, as seen in Figure 5.

Figure 5: The various kinds of trends offered in Microsoft Excel.
What are Some Common Mistakes Seen in Poorly Written Engineering Lab Reports?
- Trendline missing or misplaced.
- R2 value not shown on the plot.
- Incorrect or inappropriate trend selected to describe the data.
- Data include a value for which a trendline value may be undefined (e.g. ln(0)) resulting in a trendline that cannot be applied.
References
- Kim, J., Kim, D., (2019) “How engineering students draw conclusions from lab reports and design project reports in junior-level engineering courses,” The Proceedings of 2019 ASEE Annual Conference and Exposition, Tampa, FL, June 2019. Available:
https://peer.asee.org/how-engineering-students-draw-conclusions-from-lab-reports-and-design-project-reports-injunior-level-engineering-courses.pdf - “Argument Papers”, Purdue University, Purdue Online Writing Lab, Argument Papers,
Available: https://owl.purdue.edu/owl/general_writing/common_writing_assignments/argument_papers/conclusions.html - “Student Writing Guide”, University of Minnesota Department of Mechanical Engineering, Available:
http://www.me.umn.edu/education/undergraduate/writing/MESWG-Lab.1.5.pdf