Outside Looking In
Project Overview
This research site is the result of a collaborative effort involving the hard work of numerous individuals from across the U.S. Our wish is for the collaborative spirit that drove this project to continue.
Scholars
Scholars interested in exploring the topic of legislative civility further will find the original survey instrument used to collect the extensive dataset. They will also find the actual dataset in SPSS, Stata, and Excel formats, along with searchable database for the written comments submitted by the state legislative lobbyists who participated in our survey. This website also contains information about the National Survey of State Legislative Lobbyists itself, the project that led to the creation of the dataset, the study’s primary findings, and links to research papers and published articles that grew from this collaborative research effort. We also include a discussion of our future research plans related to legislative civility and opportunities for others to join us in this work.
Practitioners
Practitioners will find presentation resources used by the authors, at several different places across the U.S., on our findings as they relate to legislative civility. For those interested in hosting a future presentation of their own, contact information is also included in the website.
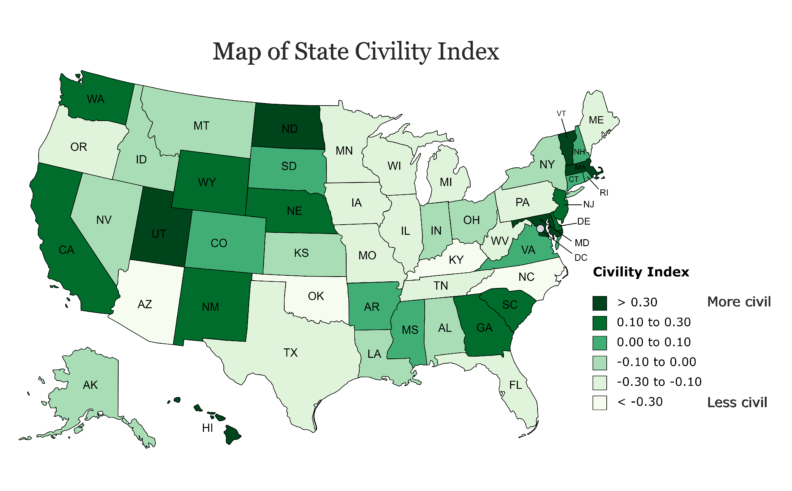
Figure 1: Description of Map Data
State Level Civility Index [Excel File]
Figure 1 illustrates the distribution of the civility index across states; states are subdivided into six categories using natural breaks. States with the highest civility index scores (i.e., highest levels of civility) are Massachusetts, Maryland, Utah, North Dakota, Hawaii, and Vermont, while states with the lowest index scores are Kentucky, Arizona, North Carolina, and Oklahoma. Although visual analyses do not indicate any specific geographic patterns, regional averages indicate that the Northeast (.07) and West (.08) are more civil than the South (-.07) and Midwest (-.05). Of course, there are some noteworthy outliers to these overall trends. For example, North Dakota in the Midwest and Maryland in the South have among the highest levels of civility within regions with relatively low levels, while Pennsylvania and Maine in the Northeast, and Arizona and Oregon in the West have among the lowest levels of civility in regions with relatively high levels. Looking further at subregions, New England (.13 for Connecticut, Maine, Massachusetts, New Hampshire, Rhode Island, and Vermont) and the Pacific states (.10 for Alaska, California, Hawaii, Oregon, and Washington) have the highest averages. In contrast, the West South Central (-.17 for Arkansas, Louisiana, Oklahoma, and Texas), East North Central (-.16 for Illinois, Indiana, Michigan, Ohio, and Wisconsin), and East South Central (-.14 for Alabama, Kentucky, Mississippi, and Tennessee) have the lowest averages.